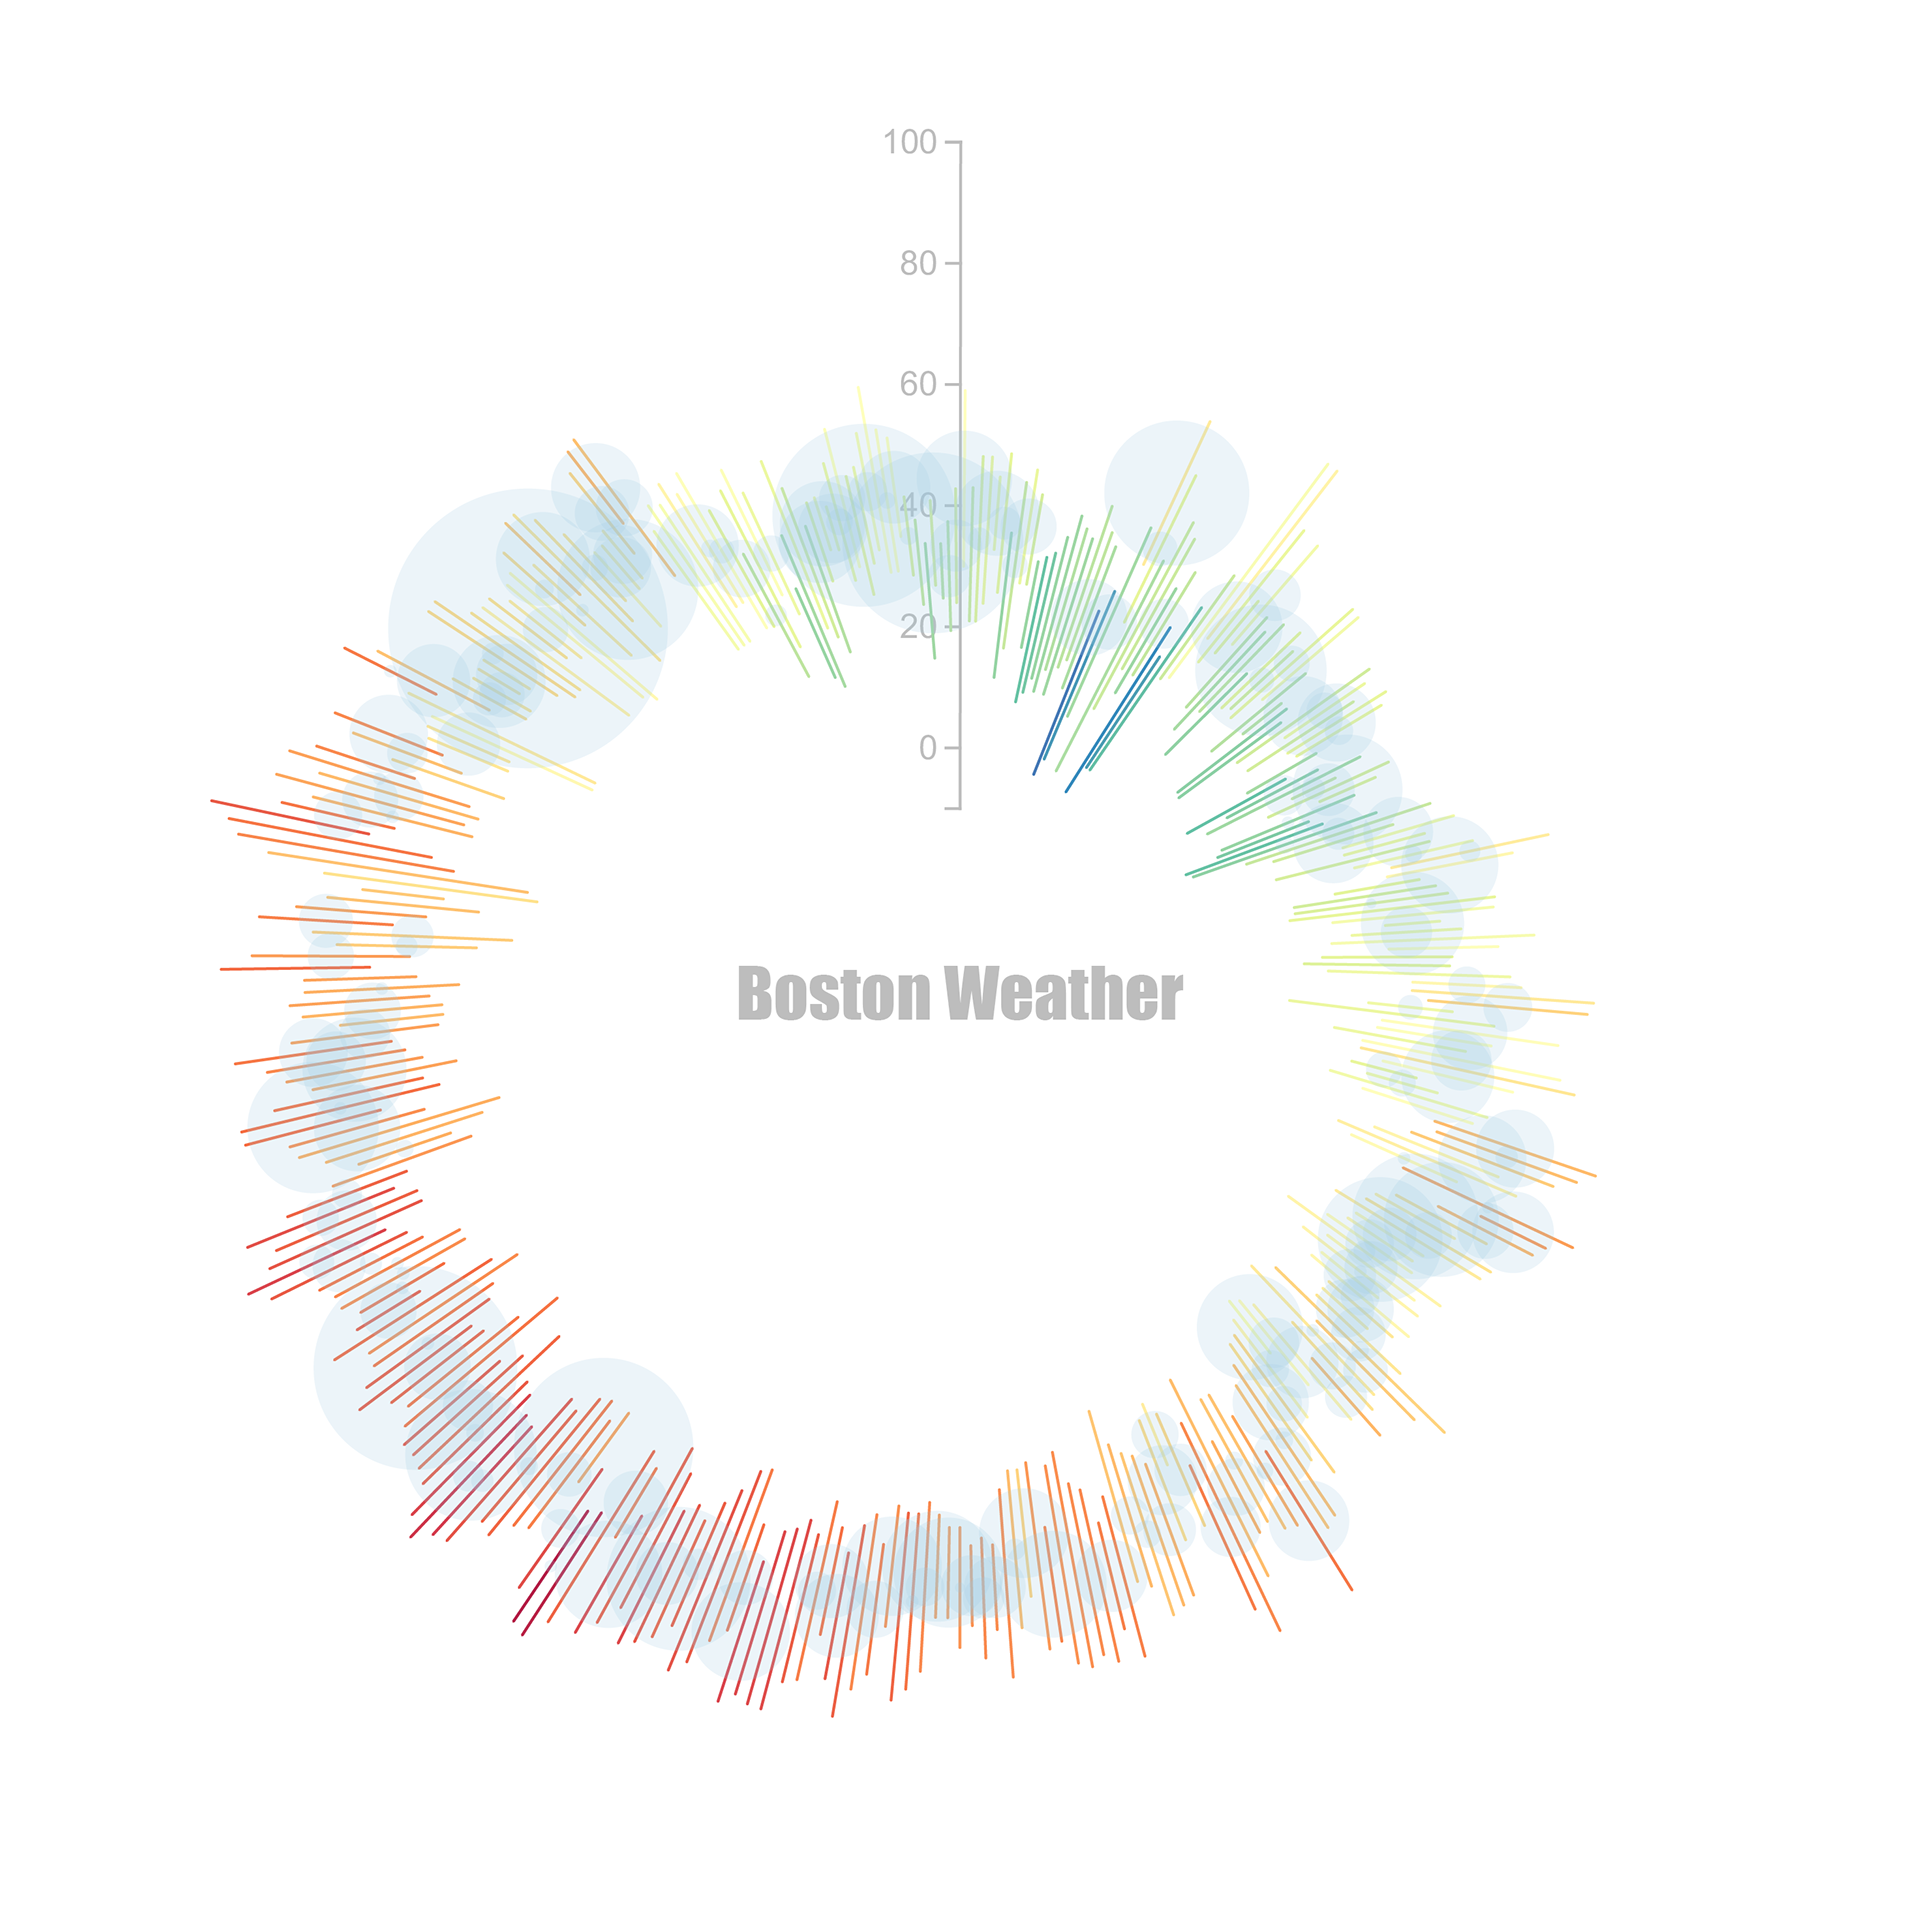
Weather Radial
Visualizes weather data for Boston from January 1 to December 5, 2019. Circles represent precipitation
while length and color of lines represent temperature range. Created with Charticultor.
while length and color of lines represent temperature range. Created with Charticultor.
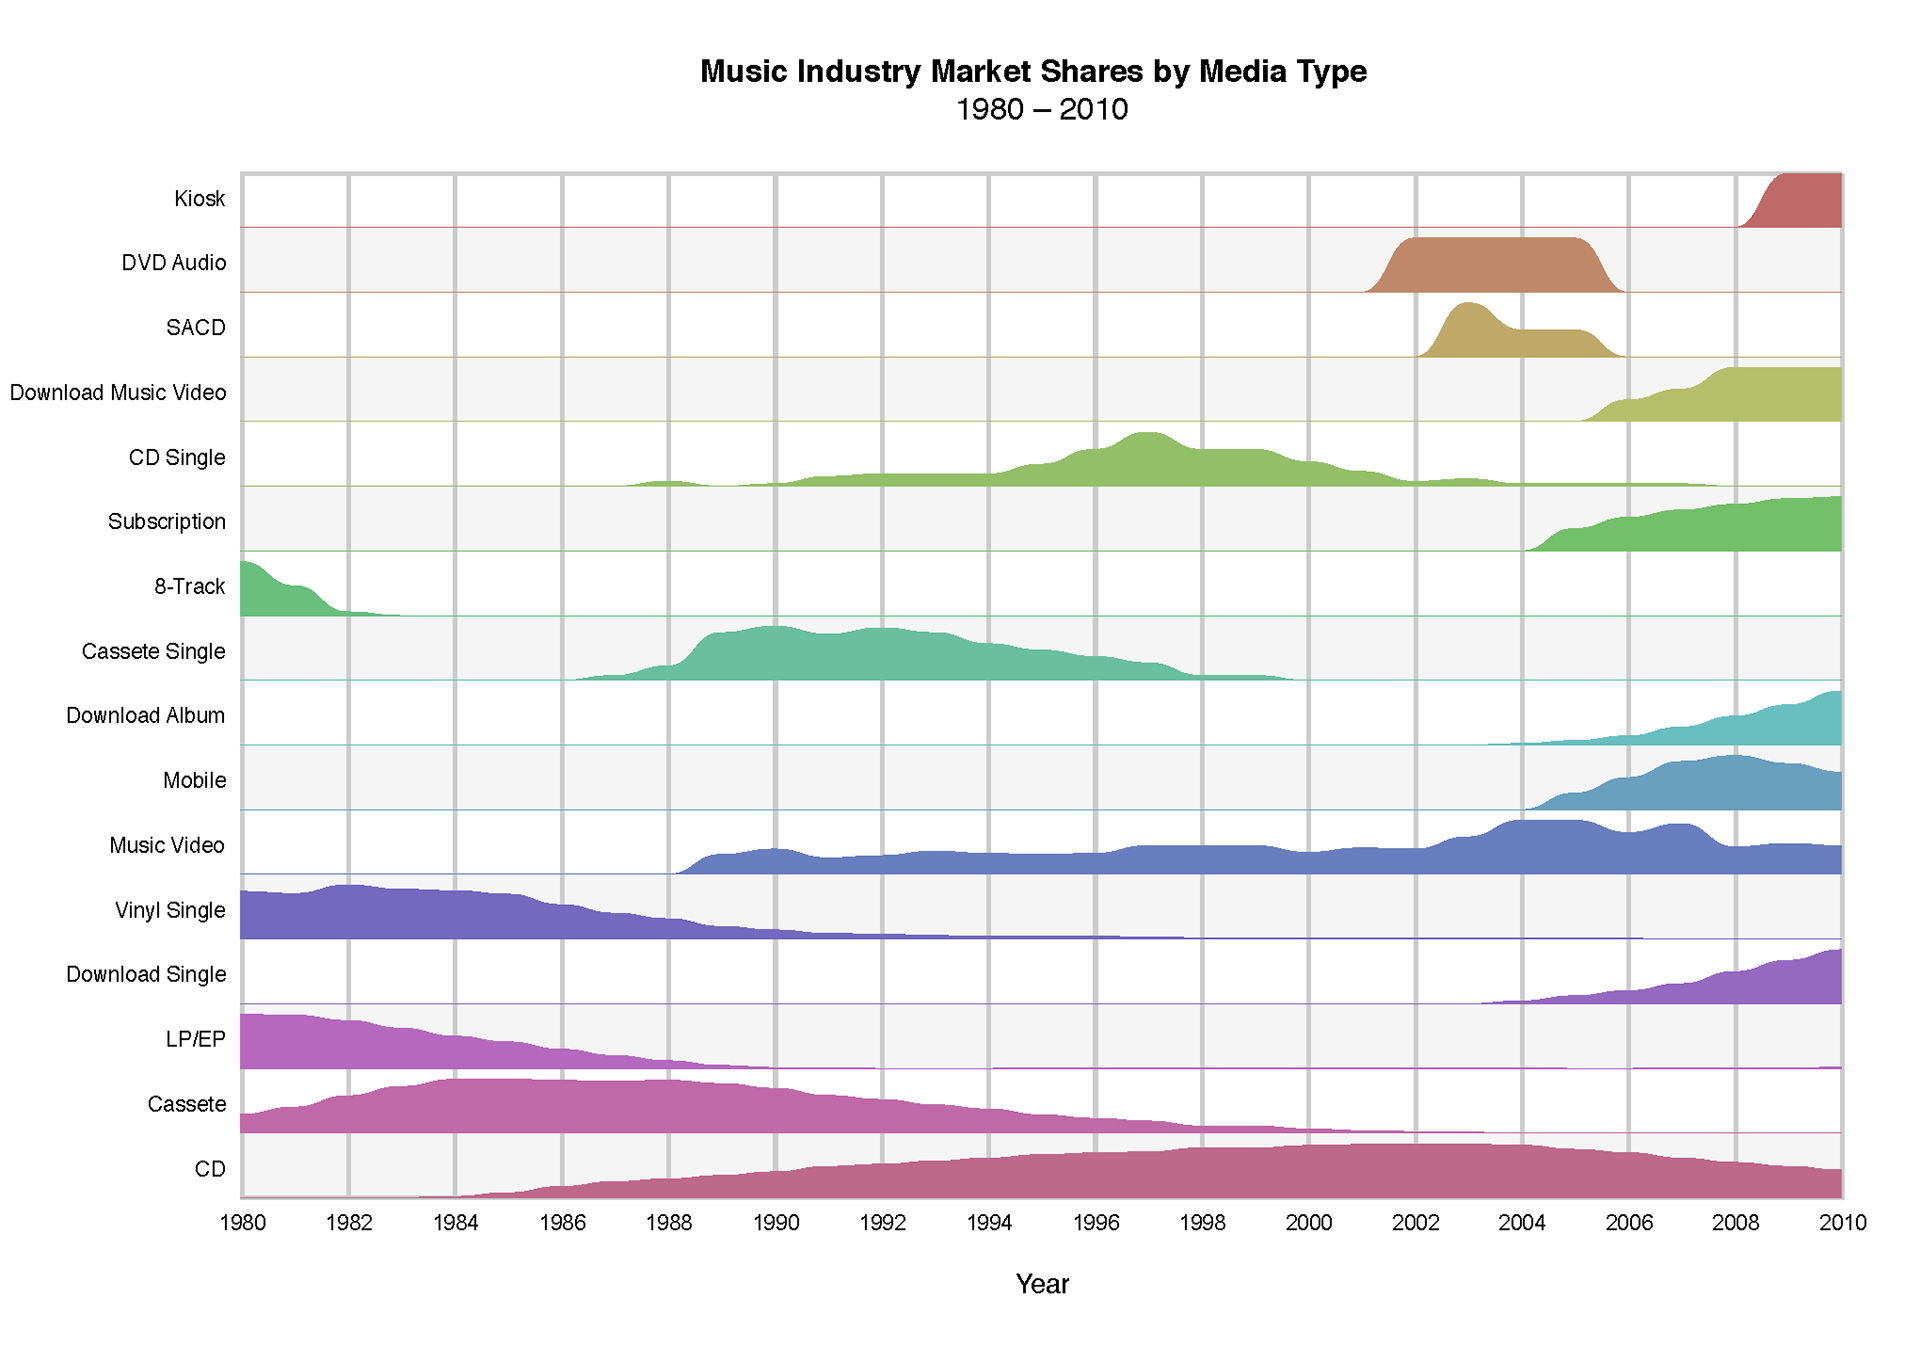
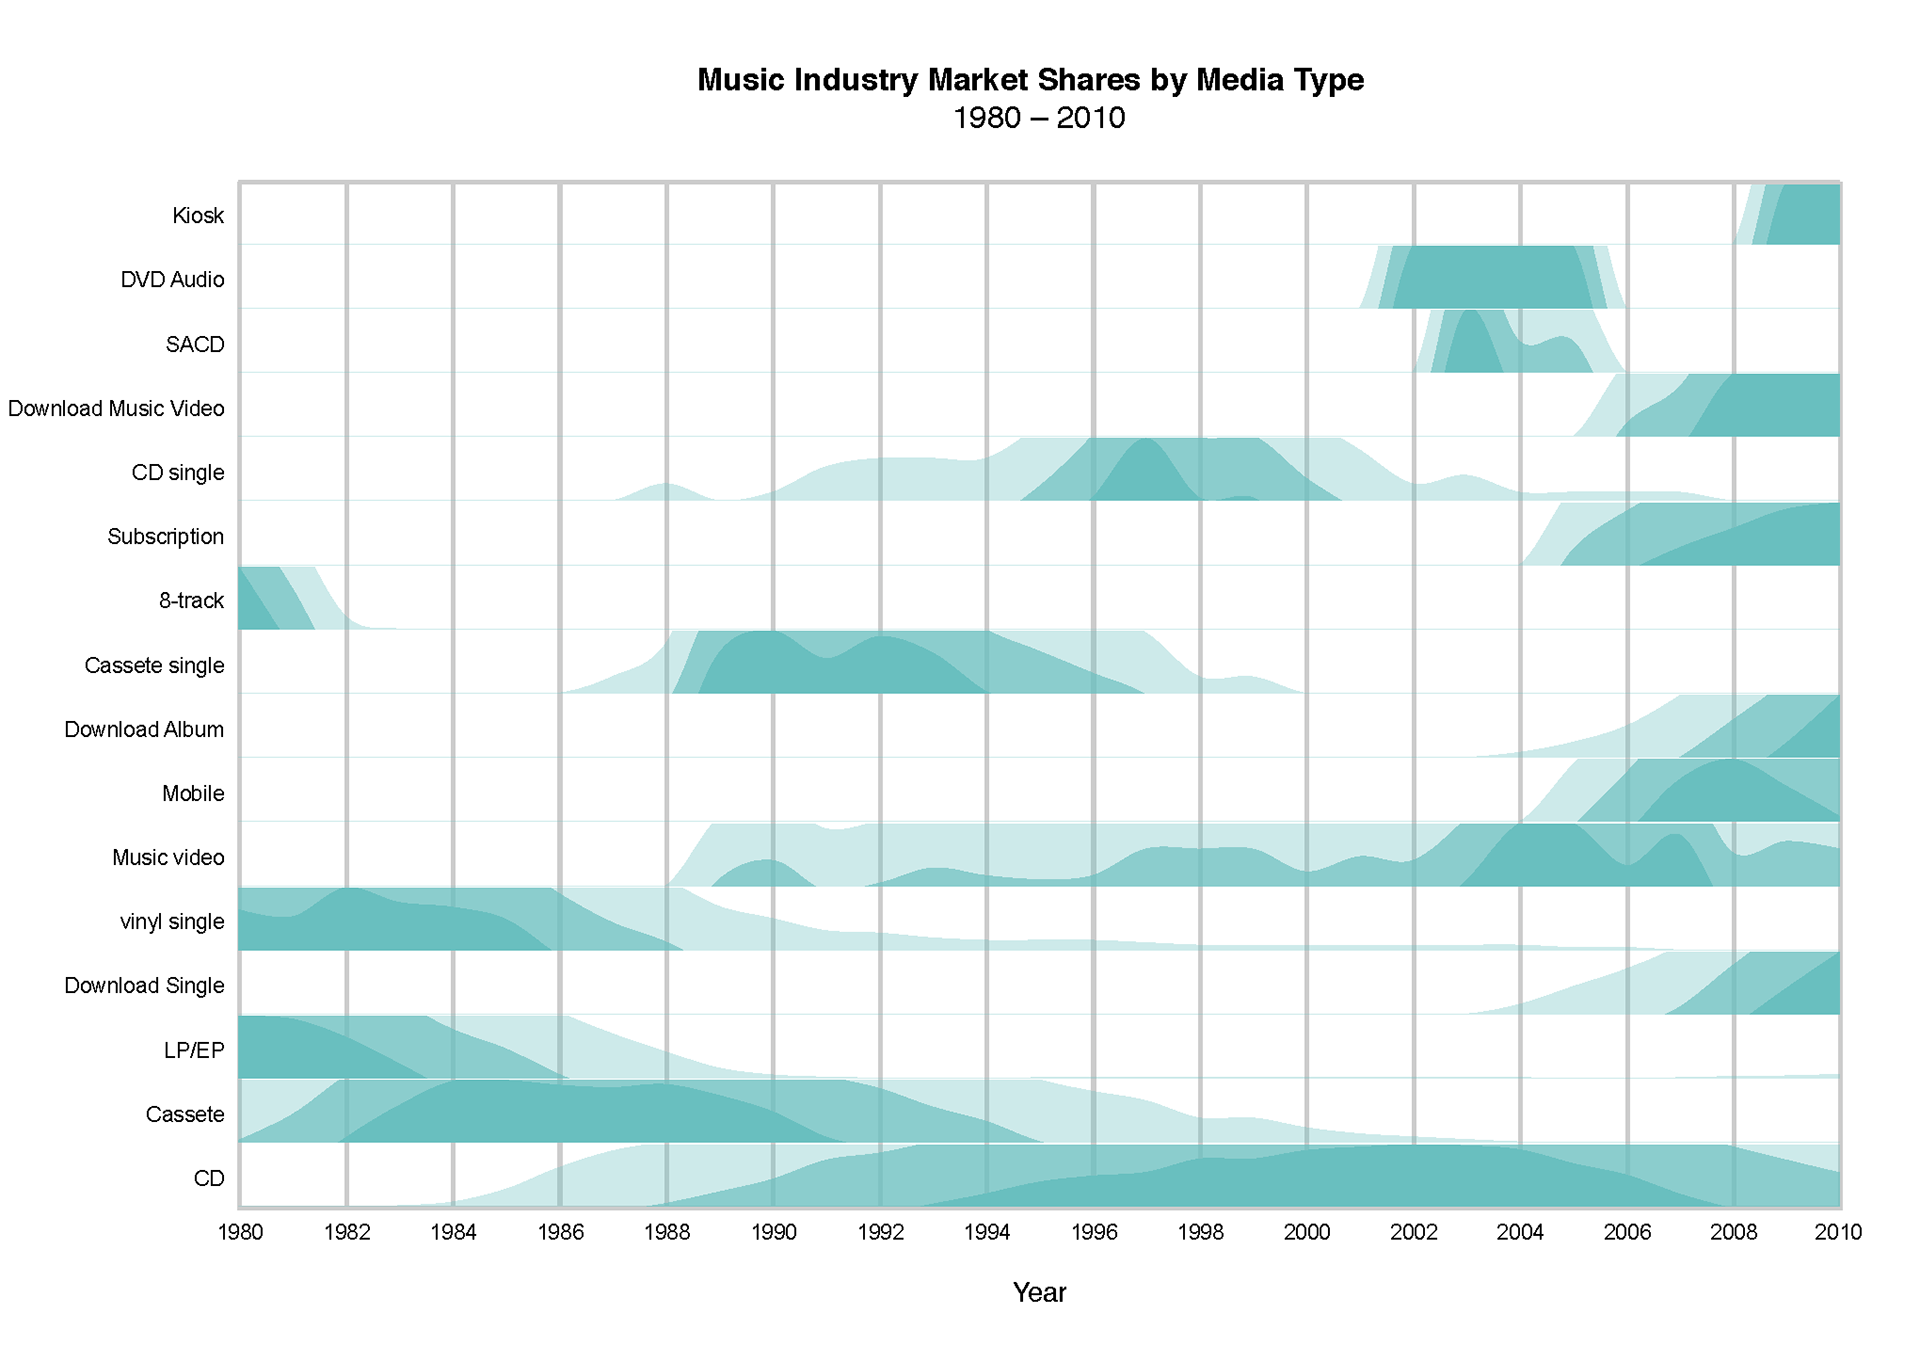
Area Chart & Horizon Chart
Two different visualizations of music industry market share data. Created with RawGraphs.
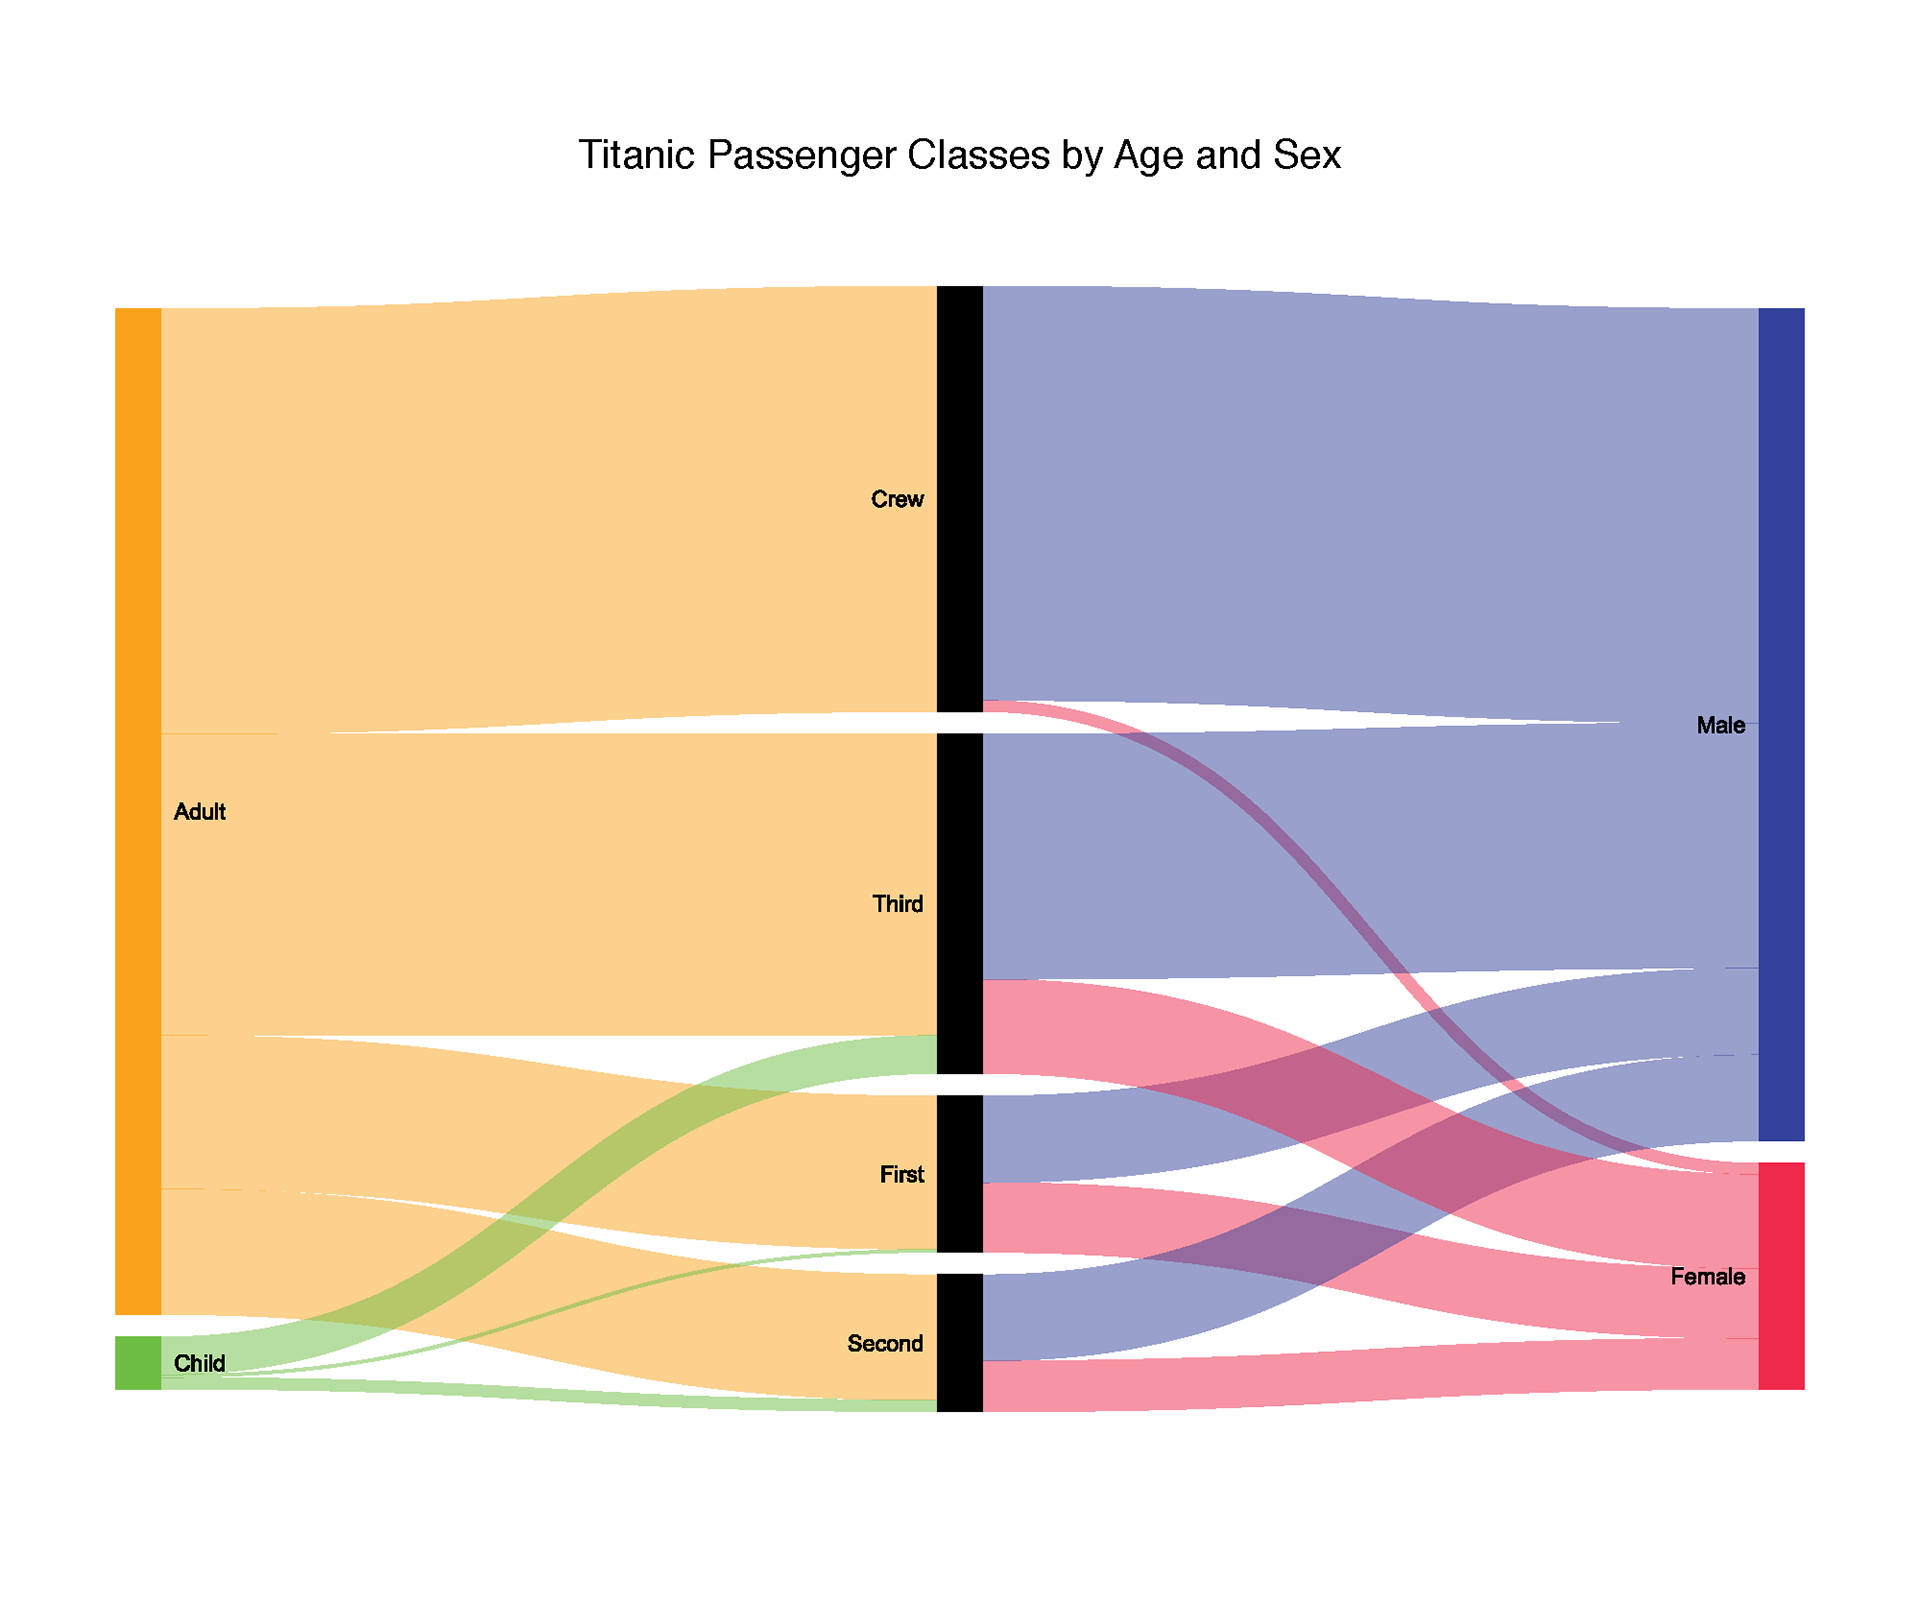
Alluvial Diagrams
The diagram on the left characterizes Titanic passengers’ class by age and sex, while the diagram on the right shows ratios of survival according to Titanic passengers’ sex and class. Created with RawGraphs.

Interface Design Sketch
A sketch of an interactive interface that visualizes ridership of the Vienna subway system for one month.
This model implements some of the tasks highlighted in Ben Shneiderman's paper, 'The Eyes Have It': overview, relate, and zoom, filter, and details-on-demand. Created with Adobe Illustrator.
This model implements some of the tasks highlighted in Ben Shneiderman's paper, 'The Eyes Have It': overview, relate, and zoom, filter, and details-on-demand. Created with Adobe Illustrator.
OVERVIEW:
Ridership changes from day to day, and from station to station. This visualization displays a temporal overview as well as a geographical/station overview for the whole month
Ridership changes from day to day, and from station to station. This visualization displays a temporal overview as well as a geographical/station overview for the whole month
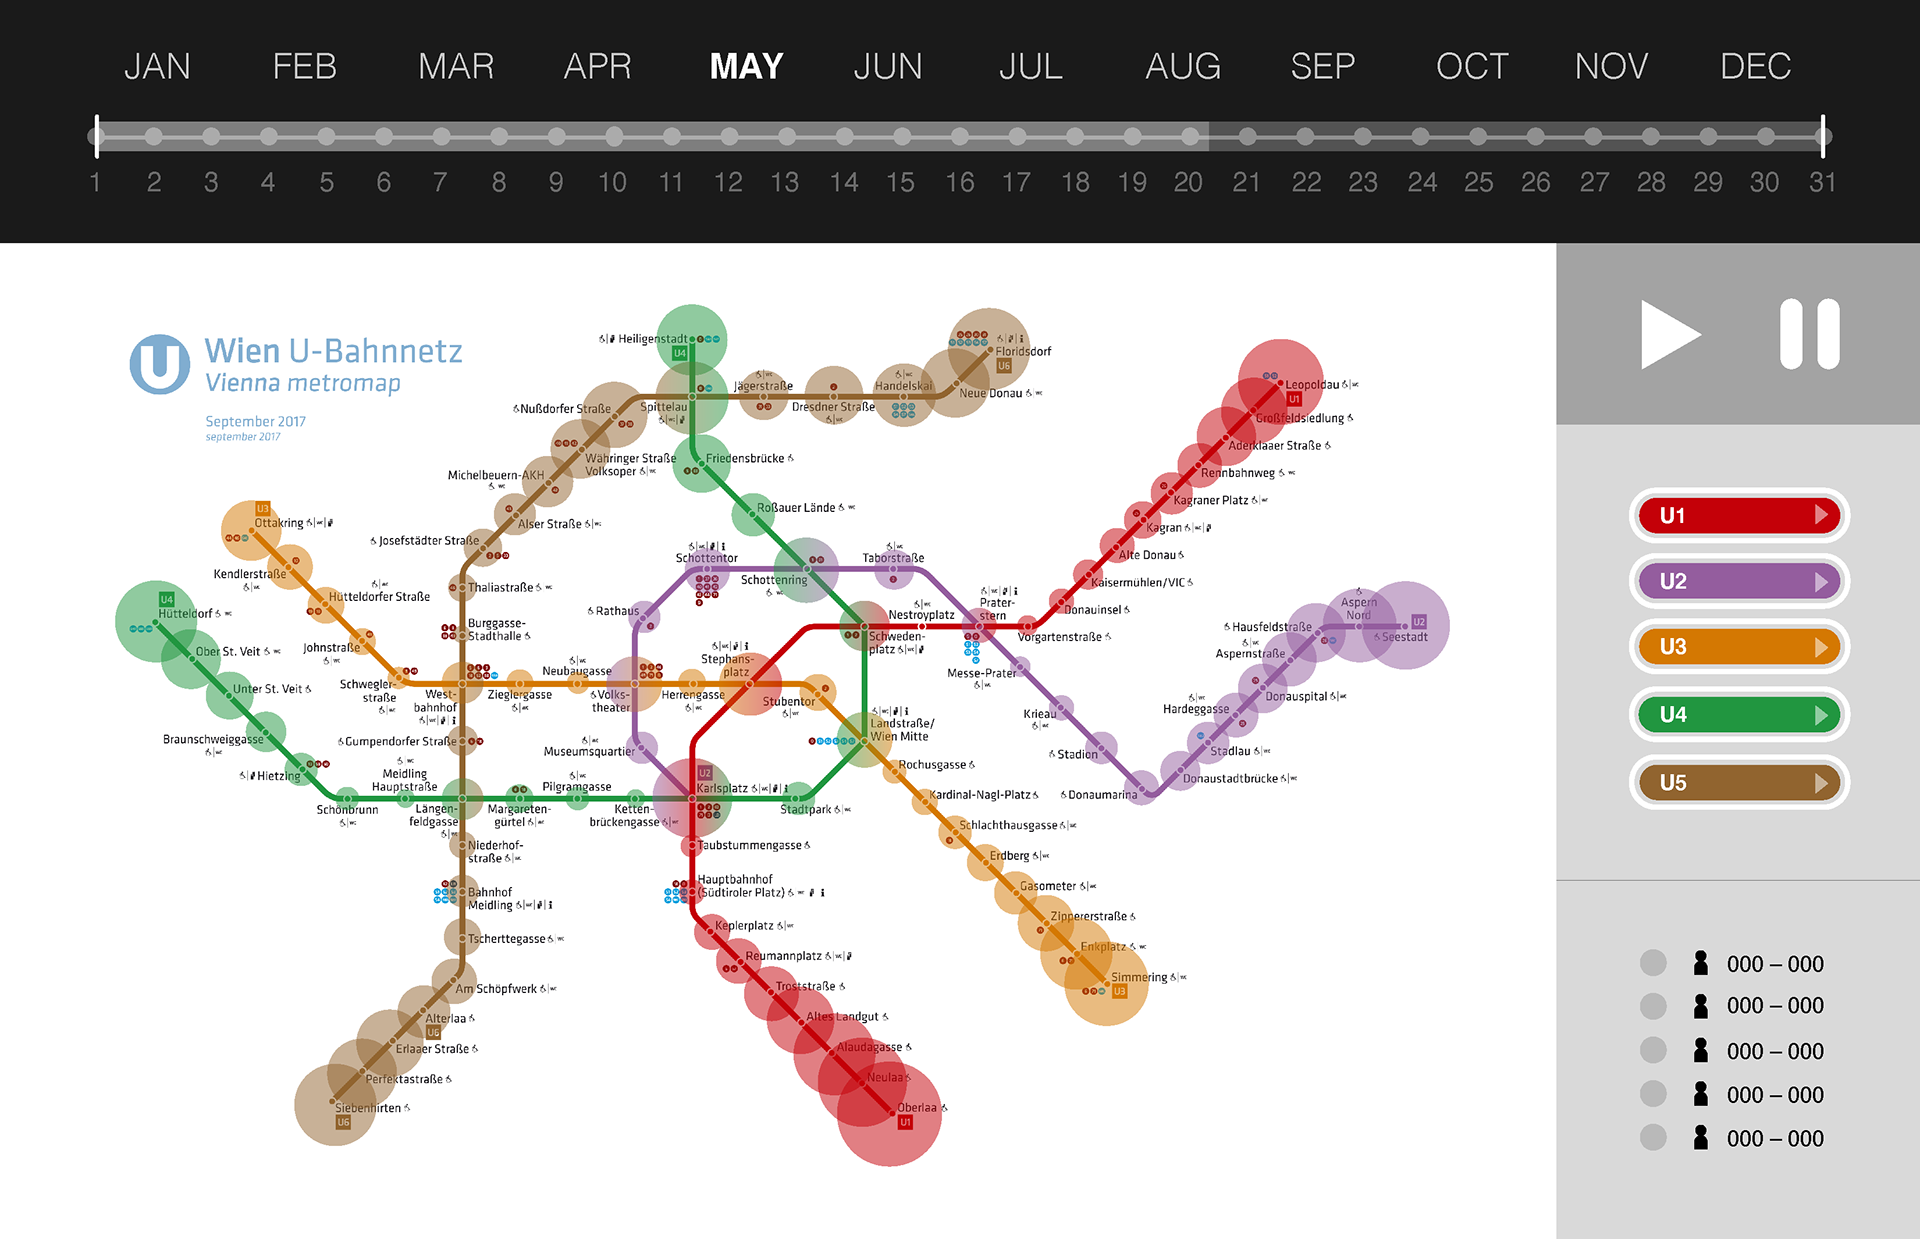
RELATE:
A station has a certain ridership for a certain period of time. This visualization indicates other stations with
a similar ridership within a defined tolerance
A station has a certain ridership for a certain period of time. This visualization indicates other stations with
a similar ridership within a defined tolerance
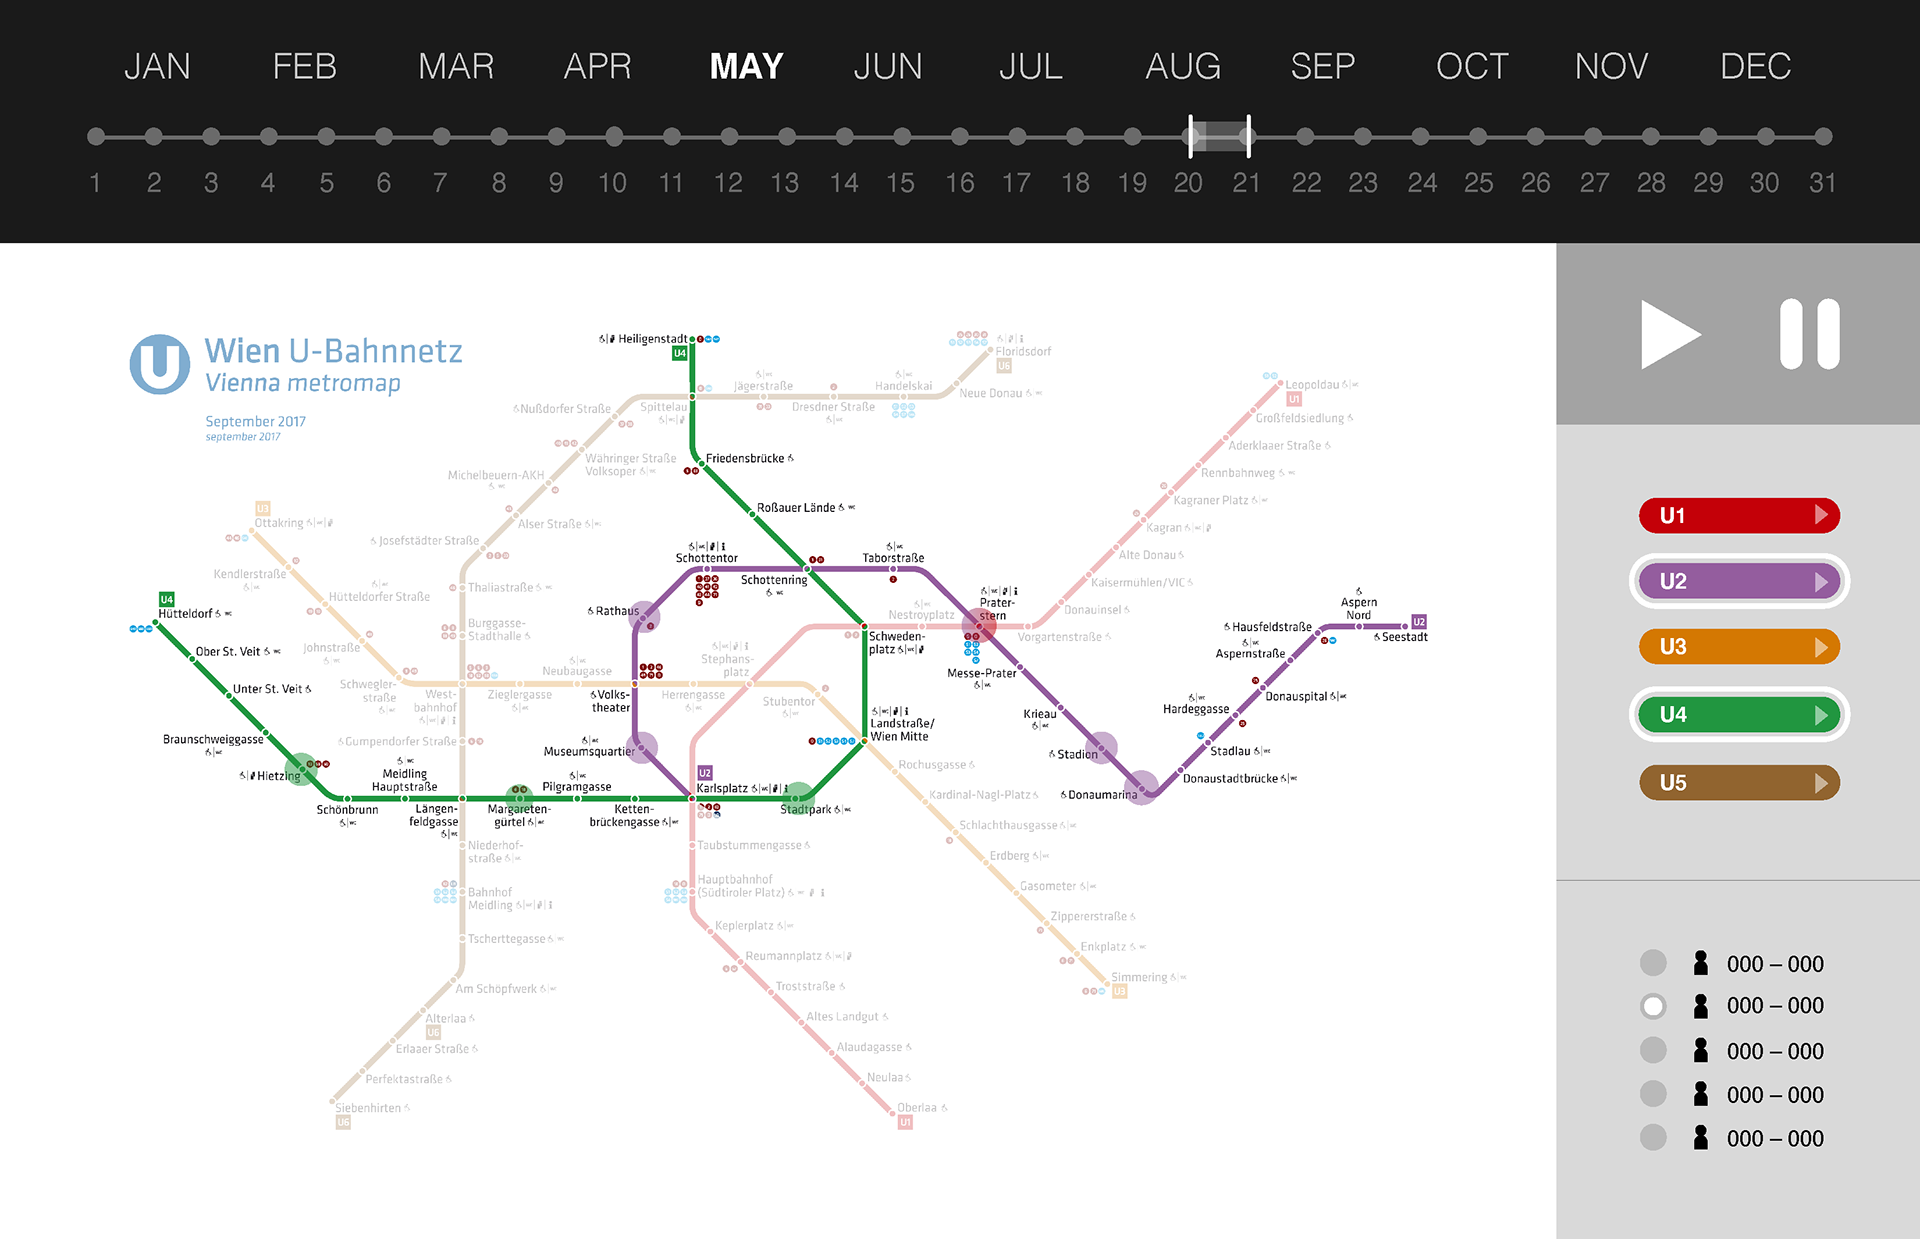
ZOOM, FILTER, and DETAILS-ON-DEMAND:
This visualization identifies what the busiest hour was for a given station on a given day. Busiest hours, or rush hours, can change from day to day, and from station to station. Because of this variation, this visualization enables the user to compare rush hours for a certain set of stations at the same time.
This visualization identifies what the busiest hour was for a given station on a given day. Busiest hours, or rush hours, can change from day to day, and from station to station. Because of this variation, this visualization enables the user to compare rush hours for a certain set of stations at the same time.

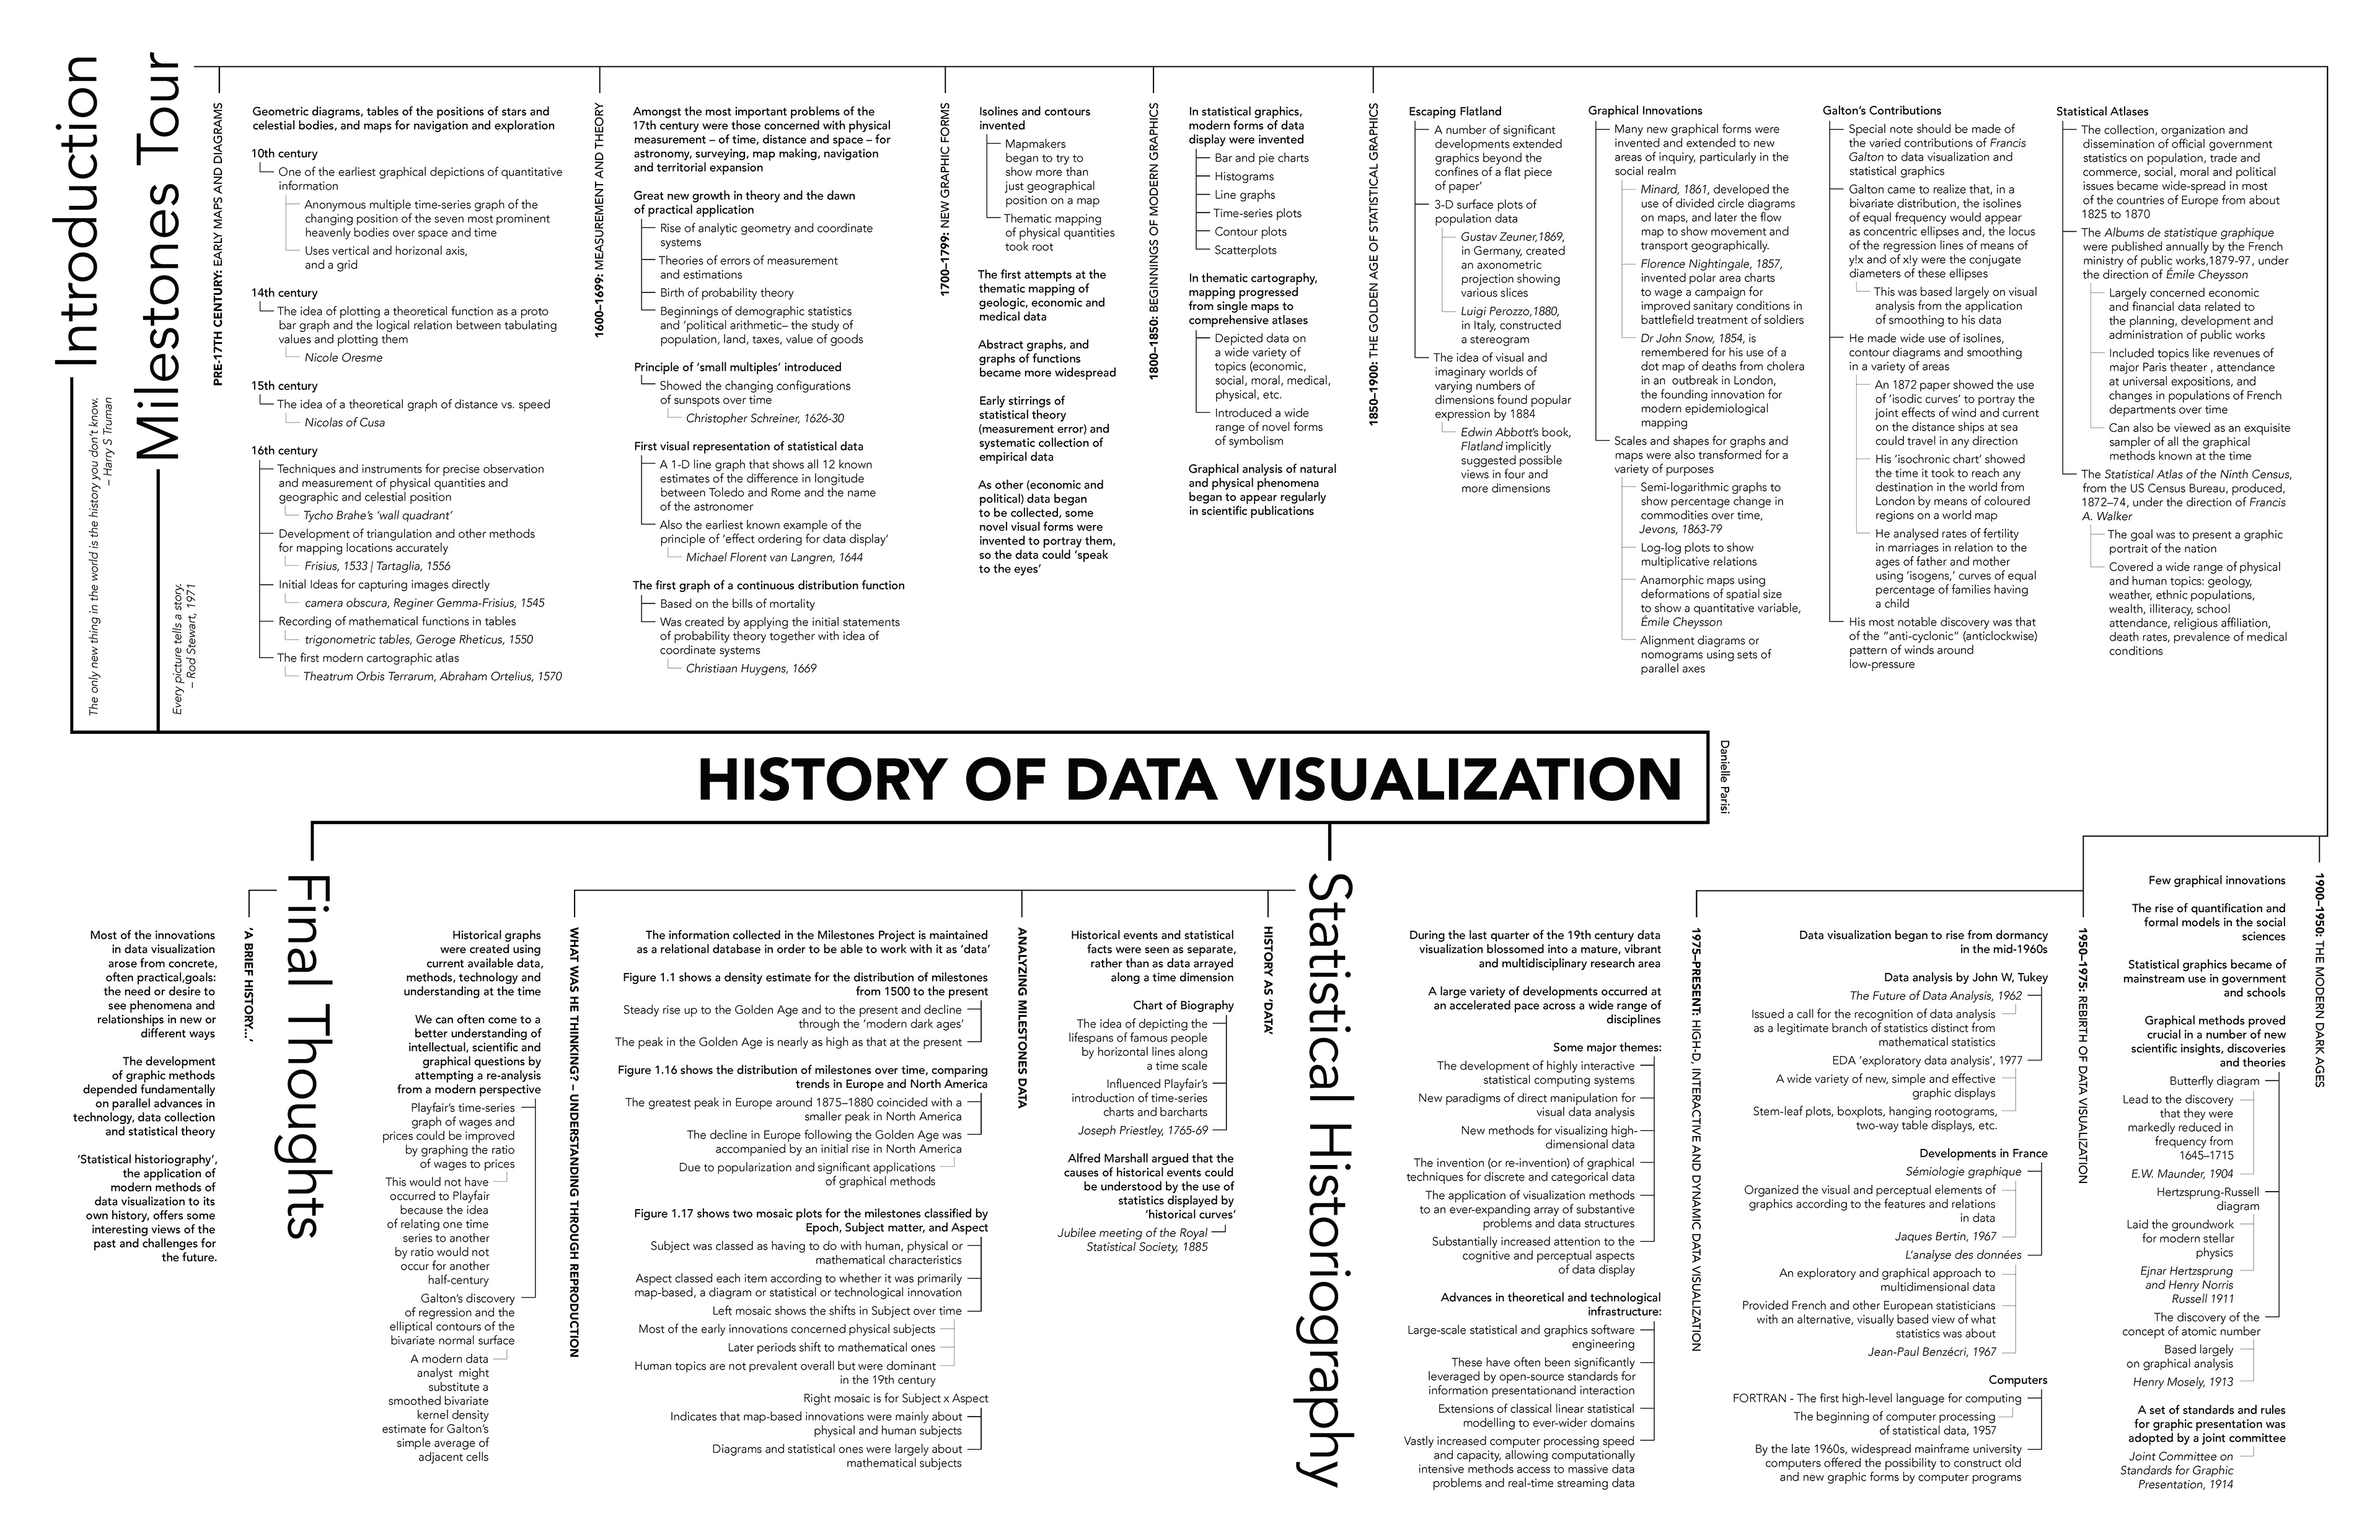
Text Diagram
An outline of 'A Brief History of Data Visualization' by Michael Friendly. Project constraints: no colors other than solid black, no shapes other than straight lines, use only one typeface, use only two sizes for type.
Created with Adobe InDesign.
Created with Adobe InDesign.
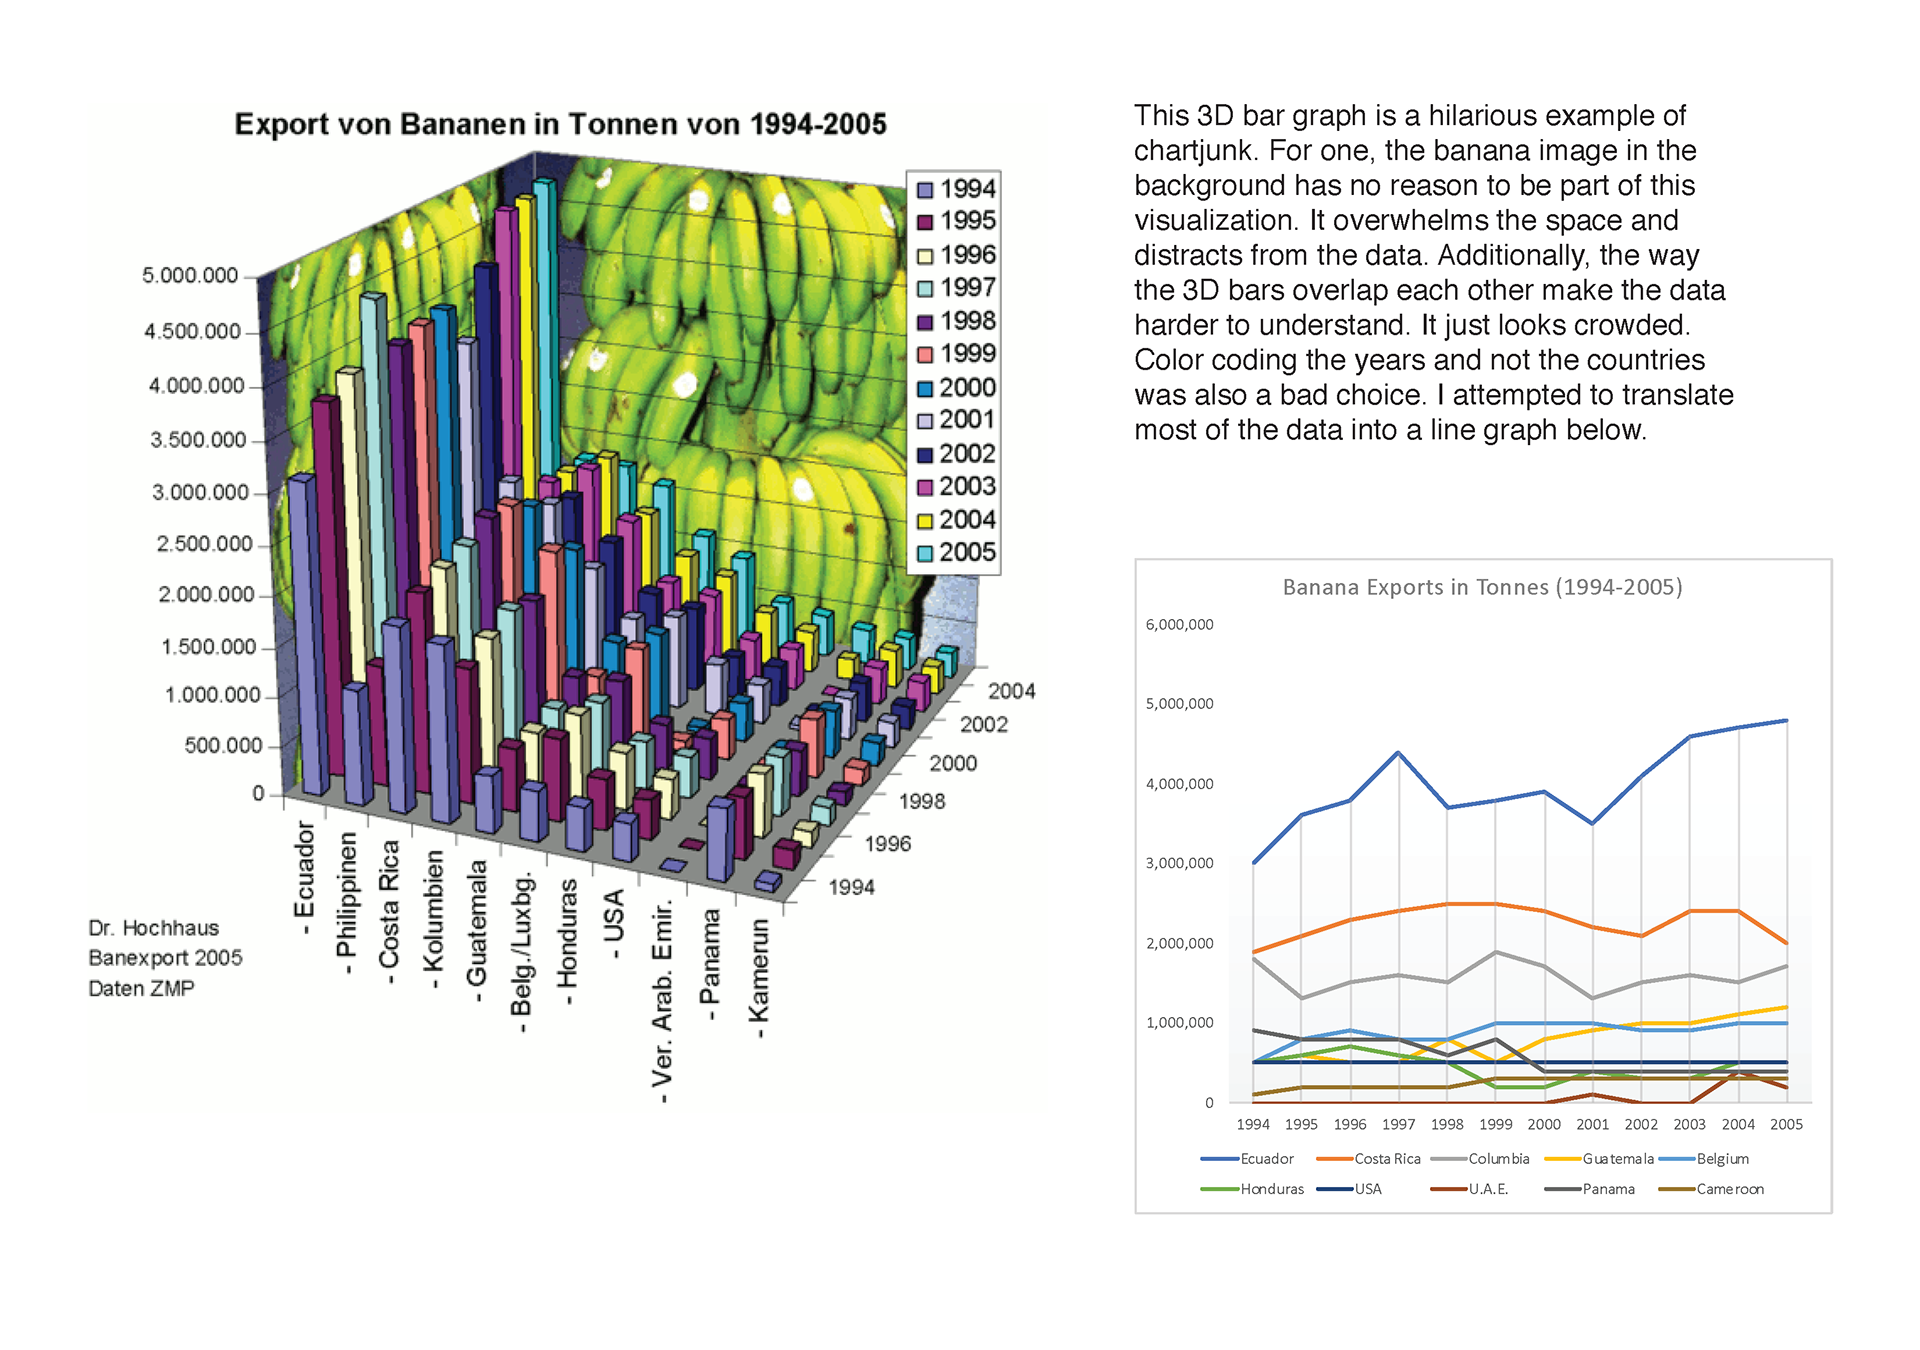
Tuftish Principles: Graphical Integrity & Chartjunk
Examples of visualizations that are noticeable infringements of Tufte's information design principles found on the internet, and redraws of the visualizations that correct the infringements. Redraws created with Microsoft Excel.